

In Javascript, we have a big library at our disposal that can be extremely helpful for making our job easier, from options that allow us to generate PDF documents, up to other ones that allow us to generate dynamic charts by simply providing it with some data.
In this case, we’ll focus on one of those useful libraries: ChartJS, and how we can use it in Salesforce.
How can ChartJS be helpful to me?
Salesforce already has a feature that allows us to create easy to visualize charts: dashboards, so how can we benefit from using Chart.js?
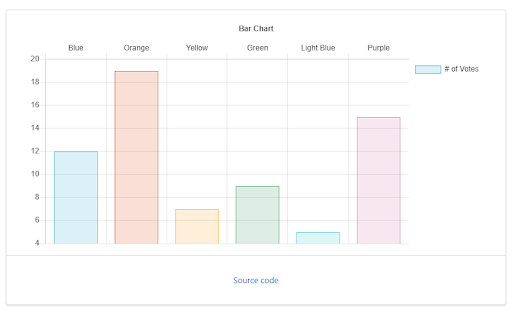
Chart.js is an open source library that allows us to easily create charts that are modern, varied and adaptable (or as it is more popularly known in English, they are “responsive”), apart from giving us enough freedom to configure them as we wish, which makes ChartJS an excellent choice if you:
- 1) You need charts for an Experience Site (also known as Communities).
- 2) You need charts that look good on a mobile device screen.
- 3) You need charts with a level of customization that exceeds what you find in the default Salesforce dashboards.
It is precisely because of how useful this can be that there is already an implementation of Chart.js in Salesforce called “Lightning Web Chart JS”, courtesy of Salesforce Labs, which makes it very easy for us to install and use.
Now, with that said, let’s get into the action.
How to install Chart.js
There are two main ways to install ChartJS, let’s see what they are and how they differ:
- 1) AppExchange: Chart.js (or Lightning Web Chart JS in this case) has its own page on the AppExchange, which you can access through the following link:
https://appexchange.salesforce.com/appxListingDetail?listingId=a0N3u00000MBarPEAT&tab=eInstalling it from the AppExchange will allow you to add the charts to any page in Salesforce through the AppBuilder, and will allow you to configure them in a mostly declarative way. This option has the disadvantage of making it impossible to access more advanced chart configurations or to use them in Lightning Web Components from Visual Studio Code.
- 2) GitHub: You can find the source code of the Chart.js implementation in Salesforce at the following link:
https://github.com/SalesforceLabs/LightningWebChartJSFrom here, you can download the necessary code by going to force-app -> main/default.
As you will notice, you will need to download Apex classes, Lightning Web Components, Permission Sets, and static resources; make sure you don’t forget any of them! Once you have downloaded them, all you have to do is copy them into the folder of any Visual Studio Code project you have, and from there you can deploy it to the org where you want to implement it.
An interesting fact is that if you want to see examples or samples of what it looks like, you can download the folder located in force-app -> sample/default.
One of the advantages of this installation method is that you can always add the chart from the AppBuilder if you wish, but additionally, it will allow you to configure the chart from Visual Studio Code, which will allow you to achieve more customized chart, as we will see below.
How to create your first chart
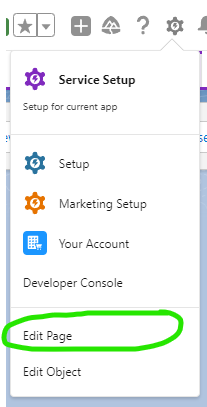
Now, as we mentioned earlier, there are two ways to add the charts. The first one requires you to go to any Lightning Record Page in Salesforce and edit it:
Once you are in the Lightning App Builder, on the left side, look for “LWCC App Builder” under the “Custom” category of the Components, and drag it to where you want to add a chart.
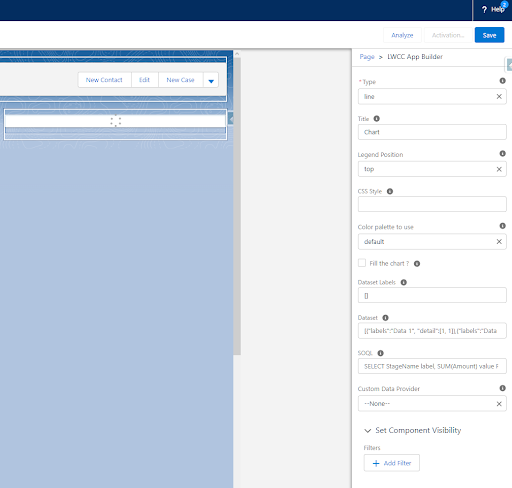
Here you will notice that you have different options on the right side of the screen to configure your chart. In case you want to see a couple of examples of what kind of values you can place here, I recommend you to visit the following link:
https://salesforcelabs.github.io/LightningWebChartJS/
The most relevant in case you want to see how a chart looks like quickly are the following:
- – Type: Here you can select what type of chart you want to use.
- – Dataset Labels: Here you can manually enter a JSON that will allow you to generate the chart with static values. It can be useful if you want to first show what the chart looks like before you start seriously working on it, similar to a Proof of Concept.
- – SOQL: Here you can enter a SOQL query that will allow you to get real data to display on your chart. Your query will have to meet certain characteristics for it to work, which you can see in more detail in the link above.
Now, let’s explore the option of creating and configuring a chart from Visual Studio Code. To do this, it will be necessary that you have downloaded the code from GitHub as we covered earlier and that you have deployed it in the org where you want to implement it.
Within Visual Studio Code, you will need to create a Lightning Web Component from scratch.
Starting with the Lightning Web Component html file, the first thing you will need to do is “call” the “chart” component and pass it the parameters you want. You can check a couple of examples on Github in the “samples” section in case you need a couple of ideas. For this occasion, I recommend you to write a code like this:
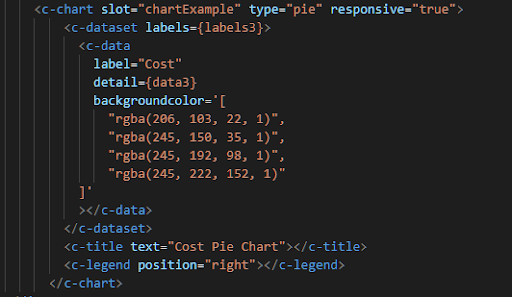
Notice how the “labels” and “detail” parameters reference variables that we will place in our .js file. In this case, the parameter “labels” will serve us to specify the legends, and “detail” to specify the data that the chart will show.
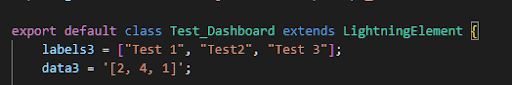
Now, we must edit the .js file of our Lightning Web Component. In case you want to add static data or test how the chart looks like, you can use a format like this:
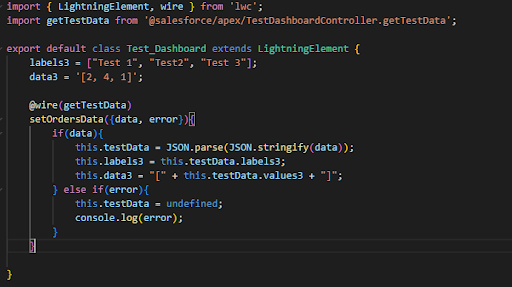
If you want to add real data, then you must create an Apex Class that will allow you to get that data, and “call” that class from the Lightning Web Component. In my case, I have created a class that in turn makes use of a “Wrapper” class so that I can pass two lists, one for the labels and one for the data to my Lightning Web Component. This is what the code looks like in the Lightning Web Component (this calls the Apex Class to retrieve the data):
I would recommend you to use a “Wrapper” class if you plan on creating more than just one chart per Lightning Web Component, as these classes allow you to easily share multiple lists with just one single parameter, making your life way easier.
Finally, all we have left is to “deploy” it and go back to the AppBuilder to add it to a page.
In case you want to experiment and browse a little about the different parameters that you can configure for each of the graphics, I invite you to read the official documentation at the following link:
https://salesforcelabs.github.io/LightningWebChartJS/docs/api.html
Carlos Llort
Carlos Llort is a Salesforce Developer with 10 Certifications and experience in multiple Salesforce Clouds. Some of his hobbies are playing video games, reading books and watching anime.
